Engaged in user operation for many years, has always been in the continuous exploration of growth. From graduation into the domestic well-known cosmetics company – e-commerce division, and then to the domestic top 3 nut snack enterprises, I have always wanted to spend time on the user of this piece of the accumulation of records, and at the same time with their own practice even if you can give you a little help also feel very meaningful.
Today, I would like to talk about traditional enterprises and e-commerce talk about more RFM model, in many customer segmentation model, RFM model is widely mentioned and used.
First, the RFM model overview
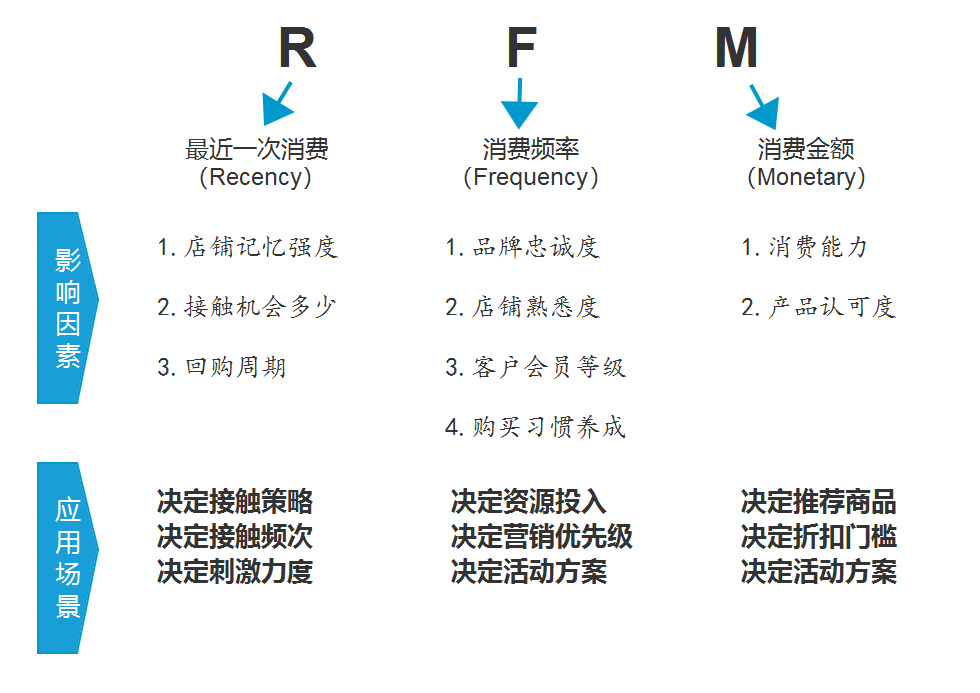
The RFM model is an important tool for the network to measure current user value and potential customer value, which is a combination of the initials Rencency (last consumption), Frequency (frequency of consumption), and Monetary (amount of consumption), as shown in the figure below.
R-value: Last Consumption (Recency)
Spending refers to the time between the last time a customer spent money in a store and the last time he or she spent money in a store. Theoretically, the smaller the R-value, the higher the value of the customer, i.e., the number of times a customer is most likely to respond to a store repurchase. Theoretically, the smaller the customer is, the higher the value of the customer, i.e., the more likely the store will respond to a repurchase. With the convenience of online shopping, customers have more purchasing choices and lower purchase costs.
The following figure shows the distribution of R-values for the most recent purchases by users of a snack store (as of December 31, 2016).
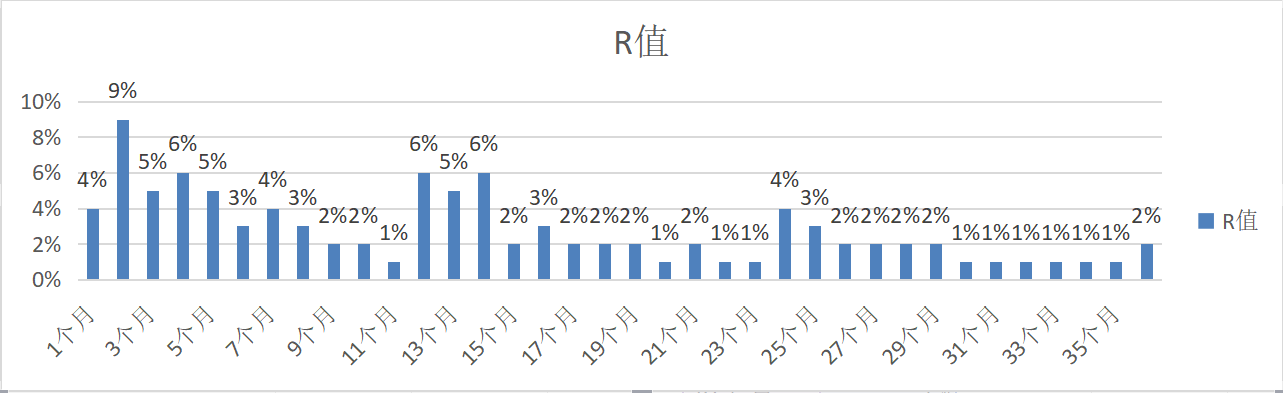
1. Customer R-values show a regular “wavy” distribution, the longer the time, the smaller the wave.
2. 50% of users within the last year (really coincidental).
Data Analysis: This data is already ideal based on consulting with industry professionals. It means that for every 2 customers introduced, there is one user who keeps buying. It means that the store is doing a good job of repurchasing, and the R-value is constantly changing to 0.
F-value: frequency of consumption.
Consumption frequency is the number of purchases a customer makes in a fixed period of time (usually 1 year). However, if the actual store is affected by the width of the category, such as selling 3C products, durable goods, etc., it is difficult for even loyal fans to make multiple purchases within a year. Therefore, when operating the RFM model, the store will remove the time range of the F value and replace it with the cumulative number of purchases.
The following figure shows the purchase frequency of a snack store user (e.g., if a customer buys multiple orders in a day, they are automatically combined into one order).
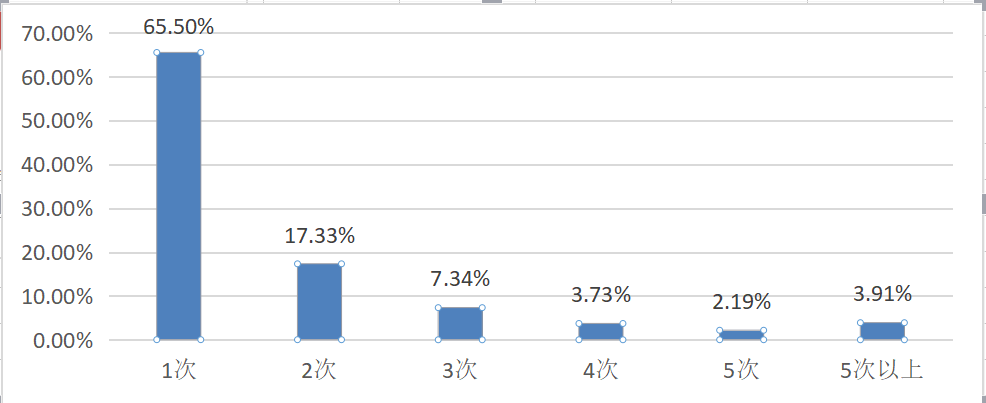
1. purchase once (new customers) accounted for 65.5% and generated repeat purchases (existing customers) accounted for 34.4%.
The percentage of those who have purchased 3 times or more (mature customers) is 17%, and the percentage of those who have purchased 5 times or more (loyal customers) is 6%.
Data analysis: The core factor influencing repurchase is products, so repurchase is not suitable for cross-category comparison. For example, food and beauty: food is a “semi-standard product”, and the higher the degree of standardization of the product, the less difficult it is for customers to betray, and the more difficult it is to form loyal customers; but compared to beauty, food is consumable, with a short consumption cycle, high purchase frequency, and relatively easy to generate repeat purchases. Comparability.
M-Value: Amount of Consumption (Monetary)
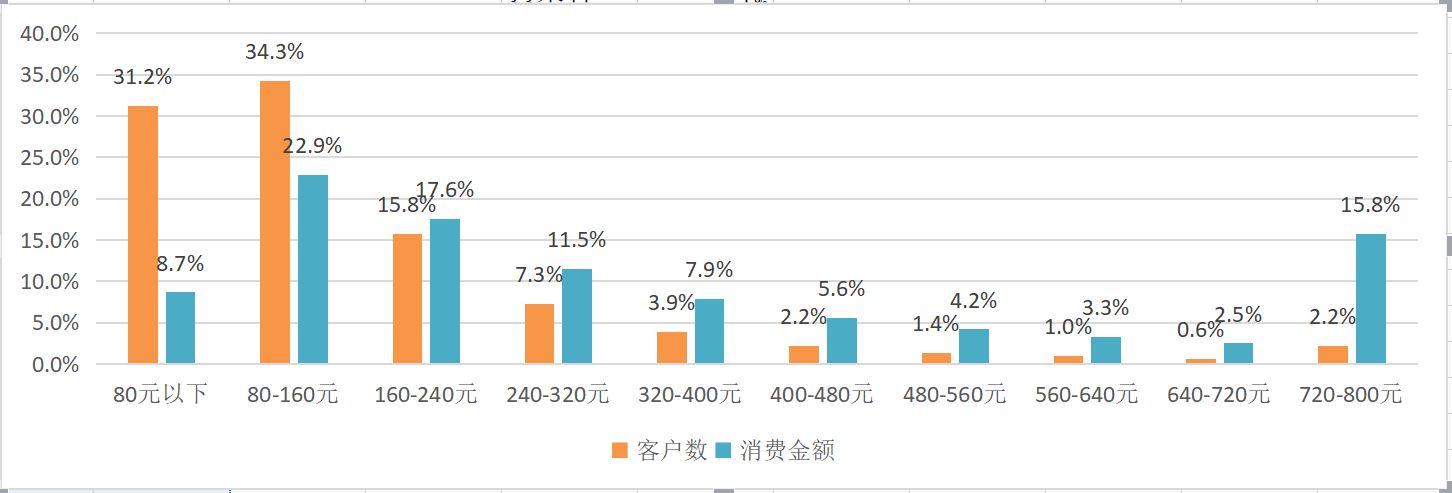
M-values are the most difficult to use in RFM models, but the most valuable metric relative to R-values and F-values. The well-known “Law of 28” (a.k.a. “Pareto’s Law”) states that 80% of a company’s revenue comes from 20% of its users.
I’ve verified this in all the companies I’ve worked in! Some stores may not be so precise, but they are also very good at keeping the 30% of customers contributing 70% of revenue, or 40% contributing 60% of revenue.
Theoretically, M-value and F-value are the same, both have a time range, which refers to the amount of consumption over a period of time (usually 1 year). In my work, I think that for general store categories, the price bands of products are relatively single.
Therefore, I believe that replacing the traditional M-value with a store’s cumulative purchase amount and average unit price is a better way to reflect the differences in customer spending.
I will teach you a very simple method of dividing the cumulative amount: if you take 1/2 of the unit price as the cumulative consumption amount, for example, if the unit price is 300 yuan, then the cumulative consumption amount will be divided by 150 yuan, which will result in ten segments.
Take a well-known cosmetics store in China as an example, the average unit price is 160 yuan, so the cumulative consumption amount is divided by 80 yuan as an interval.
RFM model-based practical applications
As a CRM operator, there are two main ways to analyze the results of the RFM model: customer segmentation using RFM model-based segmentation criteria and customer segmentation using RFM model-based customer scores.
1. Customer segmentation based on the RFM model
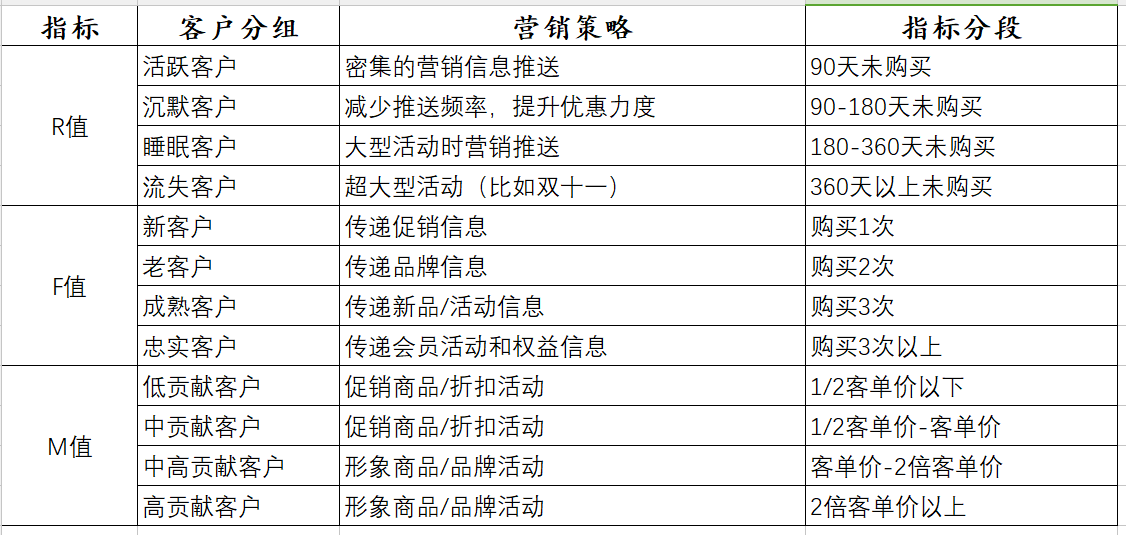
When practicing CRM, you can choose 1-3 indicators in the RFM model for customer segmentation, as shown in the table below. Once you have too many subgroups, it will be more difficult to implement your marketing plan, and you may miss out on user groups or disturb the same user several times.
The final choice of how many metrics to use is based on two criteria: the store’s customer base and the store’s product and customer structure.
Store’s customer base: the more dimensions you choose for a given store customer base, the fewer users will be segmented into each group. For stores with a small customer base (less than 50,000 customers), just select 1-2 dimensions for segmentation. For large sellers with more than 500,000 customers, you can choose 2-3 dimensions.
Store’s product and customer structure: If the store has a single product level, the difference in unit price is not large, and the purchase frequency (F value) and consumption amount (M value) are highly correlated, you can select only the easy-to-use purchase frequency (F value) instead of consumption amount (M value). For stores that have just opened and have not yet developed customer stickiness, the purchase frequency (F value) can be abandoned and the last purchase (R value) or the purchase amount (M value) can be used.
Output the target users after scoring them with the RFM model
In addition to grouping users directly with the RFM model, another common method is to score customers using the three attributes of the RFM model to determine the quality of each user and ultimately filter their target users.
There are three main components to RFM model scoring.
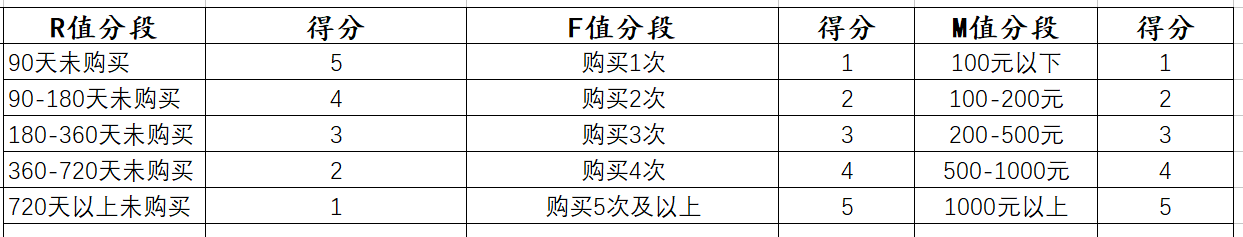
1. determine the segments of the three RFM indicators and the score for each segment.
2. calculate each client’s score for the three RFM metrics.
3. Calculate the total score for each customer and select quality customers based on the total score.
For example, in practice, each indicator is divided into 3-5 segments, where R value can be determined based on the time since the store opened and the repurchase cycle of the product, F value is based on the average purchase frequency of existing stores, and M value can be referred to the segmented indicator of unit price above.
As an example.
After confirming the RFM segmentation and the score for the corresponding segment, the user can then be scored accordingly.
At this point, some people may ask, “How can I verify that the scores given are reasonable? It is true that I can’t give a scientific reply at the moment, but if you need to verify it, you need to use an algorithmic model to verify the regression after each import of user data.
However, this is too complicated and troublesome, so if you have friends who are interested, you can verify it and make a more scientific and reasonable value for the assignment of each indicator according to the situation of different stores.
The above is only a summary of my work, if you have any questions, please feel free to communicate. If you have any questions, please feel free to communicate with us. Thank you~!
Recent Comments